There are over 2.6 million people working on agricultural farms in the U.S. that play an important role in crop work and the nation’s food system. In addition to self-employed farmers and their unhired family members, these workers include 1 million hired workers, who are primarily noncitizen immigrants. The Trump administration’s restrictive immigration policies, including limits on entry at the border and increased interior enforcement efforts, may reduce the supply of immigrant workers available to fill these roles and increase fears among some immigrants about working. Reductions in the immigrant workforce to support agriculture could ultimately have negative impacts on the cost and availability of food. Moreover, increased fears among agricultural workers could compound health challenges and risks they already face.
Using data from the 2022 National Agricultural Workers Survey (NAWS), this analysis examines key characteristics of agricultural workers, including their citizenship status, health coverage, and access to health care. The analysis includes agricultural workers ages 14 years and older who are currently employed in crop and crop-related work (see Box 1 for more details). It does not include self-employed farm workers or their unpaid family members, agricultural workers with H-2A visas, or hired livestock workers. Key takeaways include the following:
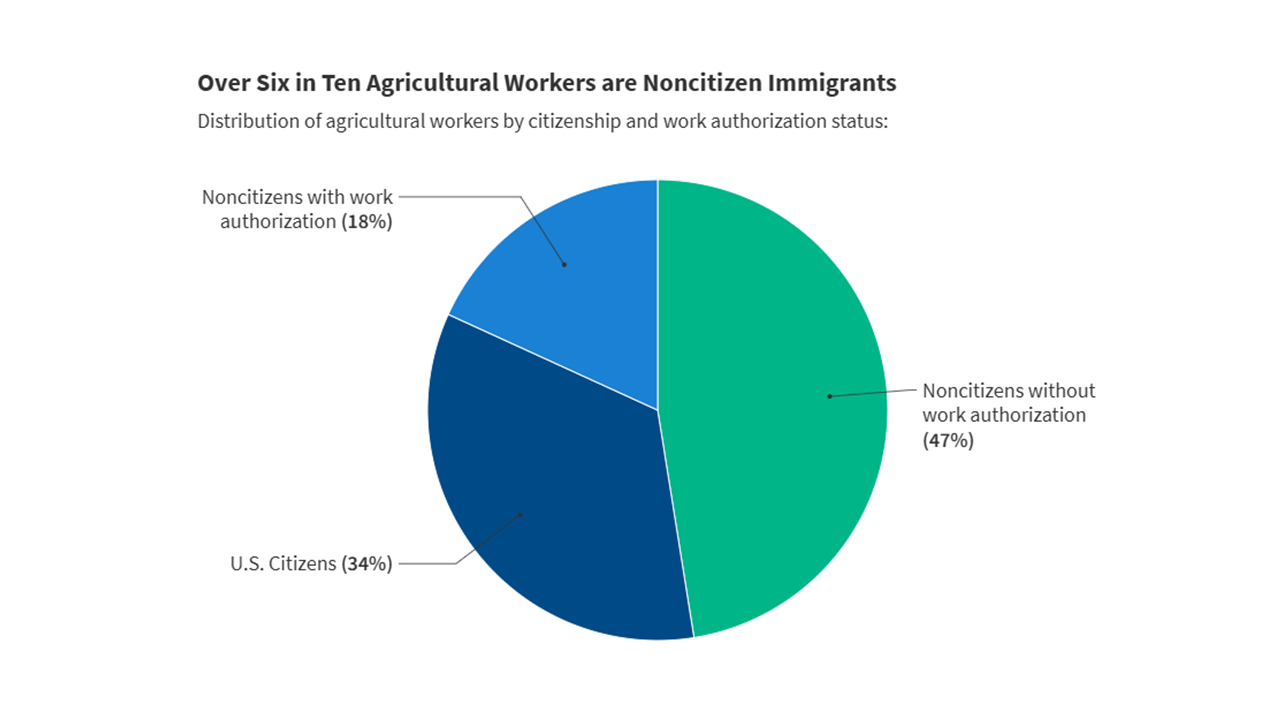
- Most agricultural workers are Hispanic, noncitizen immigrants. Overall, over seven in ten (73%) agricultural workers are Hispanic, and about two-thirds (66%) are noncitizen immigrants. This includes 18% who report having an immigration status with work authorization, such as lawful permanent status or a “green card,” and nearly half (47%) who say they lack work authorization. Additionally, one in five (19%) agricultural workers report household income below poverty.
- Among agricultural workers, noncitizen immigrants are more likely than citizens to be Hispanic and to do field work. Nearly all (97%) noncitizen immigrant agricultural workers are Hispanic compared to three in ten (30%) of citizen agricultural workers. Noncitizen immigrant agricultural workers also are more likely to be employed in field work than their citizen counterparts, with about three in four of noncitizen immigrants with and without work authorization (78% and 74%, respectively) in a field work position compared to about half of citizens (52%). Field work involves all aspects of crop production and harvest, while work in nurseries, packing houses, or elsewhere typically takes place indoors. Agricultural workers engaged in field work may be at increased risk of climate-related adverse health effects given their routine exposure to heat stress.
- More than half (53%) of agricultural workers are uninsured, with this share rising to 77% of noncitizen immigrants without work authorization compared to 41% of noncitizen immigrants with work authorization and 26% of citizens. Additionally, one in four (25%) noncitizen immigrant agricultural workers report not being able to access needed care in the past 12 months compared to 15% of those who are citizens. Going without needed care may have negative health implications, as roughly half of agricultural workers report ever being told by a doctor or nurse that they have a chronic health condition.
Box 1
The NAWS is a nationally representative survey of eligible hired agricultural workers ages 14 years and older who are currently employed in crop and crop-related work. The survey is conducted by the U.S. Department of Labor through face-to-face interviews with workers at randomly sampled workplaces from 12 regions throughout the year. These workplaces include farms, orchards, groves, greenhouses, and nurseries that are primarily engaged in growing crops, plants, vines, or trees and their seeds. Types of work include all phases of crop production (pre-harvest, harvest, and post-harvest), as well as supervising workers, operating machinery, and packing crops in certain cases. Other tasks include nursery work, grading and sorting, agricultural inspection, and farm supervision and management.
The NAWS sample includes both migrant and seasonal crop workers. The survey does not include self-employed farm workers or their unpaid family members, agricultural workers with H-2A visas, or hired livestock workers. People employed at eligible establishments who do not perform crop-related work, such as secretaries or mechanics, are also not included unless such workers also perform crop-related work.
Overview of U.S. Agricultural Workers
As of 2022, there were over 2.6 million people working on farms in the U.S, consisting of a mix of self-employed farm operators, their family members, and over 1 million hired workers. Hired workers include agricultural workers ages 14 years and older who are employed in crop and crop-related work at places like farms, orchards, groves, greenhouses, and nurseries that grow crops and plants, and are typically employed in larger farms rather than smaller or family-operated farms. These agricultural workers are concentrated in certain labor-intensive sectors, such as fruit, tree nuts, vegetable, and specialty horticultural crops that are challenging to be automated by technology. Corn, soybeans, and wheat are the leading crops produced in the U.S., with 80% of all crops going into the U.S. food system and the remainder exported to other countries.
Most agricultural workers are Hispanic, noncitizen immigrants. Overall, more than seven in ten agricultural workers say they are Hispanic (73%), a quarter report they are White (25%), and the remaining 3% report another race or ethnicity. Nearly two in three (66%) agricultural workers say they are noncitizen immigrants, including 18% who report having work authorization, including lawful permanent residents or “green card” holders, and 47% who do not report having work authorization (Figure 1). The remaining roughly third (34%) of agricultural workers are citizens. Most immigrant agricultural workers first arrived in the U.S. ten or more years ago, and they predominantly come from Mexico.
Agricultural workers who are noncitizen immigrants are more likely than those who are citizens to be Hispanic (97% vs. 30%) (Figure 2). Among agricultural workers who are noncitizen immigrants, 97% of those with and without work authorization say they are Hispanic, while among their citizen counterparts, over six in ten say they are White (64%), three in ten say they are Hispanic (30%), and the remaining 6% report another race or ethnicity.
Agricultural workers who are noncitizens also are more likely than those who are citizens to do field work (Figure 3). Overall, about two-thirds (67%) of agricultural workers do fieldwork while the remaining third (33%) work in nurseries or packing houses. Among noncitizen immigrant agricultural workers, 78% of those with work authorization and 74% of those without work authorization do field work, while among citizen agricultural workers, roughly half do either field work (52%) or work in nurseries or packing houses (48%). Field work involves all aspects of crop production and harvest, while work in nurseries and packing houses typically takes place indoors. Agricultural workers engaged in field work may be at increased risk of climate-related adverse health effects given their routine exposure to heat stress compared to other types of agricultural work that take place indoors more often.
Overall, agricultural workers have higher poverty rates than other workers. About one in five (19%) agricultural workers report household income below the federal poverty level (FPL) ($20,030 for a family of three as of 2022), higher than the share of all workers with income below poverty in 2022 (5%).
Health Coverage and Care for Agricultural Workers
About half (53%) of all agricultural workers report being uninsured, with higher uninsured rates among those who are noncitizen immigrants, particularly those without work authorization (Figure 4). Agricultural workers have a nearly five times higher uninsured rate than the rate for all nonelderly adults (10%) nationwide in 2022. Among agricultural workers, noncitizen immigrants without work authorization have the highest uninsured rate with over three in four (77%) lacking coverage, compared to about four in ten (41%) noncitizen immigrants with work authorization and 26% of citizens. These higher uninsured rates reflect a combination of limited access to employer-sponsored coverage among agricultural workers overall and Medicaid eligibility restrictions for noncitizen immigrants, including the exclusion of undocumented immigrants from federally-funded health coverage programs.
Overall, one in five (21%) agricultural workers report not being able to get health care when they needed it in the past 12 months (Figure 4). Among agricultural workers, noncitizen immigrants (25%) are more likely to report not being able to access care than those who are citizens (15%). Barriers to care likely include their higher uninsured rates, cost, and limited provider access in rural areas. Language access and immigration-related fears may pose additional barriers for those who are immigrants seeking health care. Going without needed care may have negative health implications for agricultural workers as about half (51%) report ever being told by a doctor or nurse that they have a chronic illness, including asthma, diabetes, hypertension, or other conditions. Among agricultural workers, citizens (60%) are more likely to report having a chronic condition than noncitizen immigrants without work authorization (42%). This difference may, in part, reflect more limited access to health care among noncitizen immigrants. Additionally, research shows that, overall, noncitizen immigrants, particularly those who are undocumented, generally are younger and healthier than their U.S.-born citizen counterparts.
Publisher: Source link