Are Social Security Trustees’ assumptions too optimistic?
The 2025 Social Security Trustees Report confirms what has been evident for almost three decades – namely, Social Security is facing a 75-year financing shortfall that currently equals 1.3 percent of GDP. And, if no action is taken before 2033, the depletion of reserves in the retirement trust fund will result in an automatic 23-percent cut in benefits. Also, as widely noted, compared to last year’s report, the metrics are somewhat worse. The projected 75-year deficit rose to 3.82 percent of taxable payroll, compared to 3.50 percent in 2024.
All these estimates, however, are based on the Trustees’ intermediate assumptions. Previous blogs have shown that the fertility assumptions are likely to come in lower than the intermediate projections and that we are unlikely to offset low fertility with more immigration should current policies persist. The remaining question is whether we will live longer than the Trustees’ assume.
That mortality assumptions would be important is intuitive, since the longer people live – given Social Security’s current Full Retirement Age – the more expensive the program. Mortality, however, differs from the previous fertility and immigration assumptions along two dimensions.
First, while the number of expected births is an easy-to-understand metric for fertility and net flows of people into the country for immigration, the metric for mortality is more convoluted. Death rates are generally declining, and the assumption centers on the rate at which the death rate is projected to decline. If the rate of decline is faster than the intermediate assumption, people will live longer; if it slows down, people will die sooner. The Trustees estimate that a higher rate of decline could raise the 75-year deficit from 3.82 to 4.61 percent of taxable payrolls; slower mortality improvement would lower the 75-year deficit to 3.10 (see Table 1). The possible range of outcomes for mortality is larger than that for fertility or immigration.
The second dimension in which the discussion of mortality differs from fertility and immigration is the desirability of a low-cost outcome. One can be happy if women decide to have more babies or if the United States attracts more talented immigrants, but it is hard to argue for people dying earlier. That said, it is still useful to speculate about whether the future path of mortality will break to the high-cost or low-cost side. Two pieces of evidence suggest that the actual outcome could result in a higher rate of mortality improvement than suggested by the Trustees’ intermediate assumptions.
First, comparisons show that the Social Security mortality assumptions result in a slightly lower life expectancy than other government entities. The Congressional Budget Office’s mortality assumptions result in life expectancy at birth of 82.3 years in 2055 – the end of the CBO’s projection period. In the Census 2023 projections, the assumed mortality rates result in a life expectancy at birth of 83.7 years in 2055. In contrast, the Trustees assumptions’ result in a life expectancy at birth of 82.0 years in 2055.
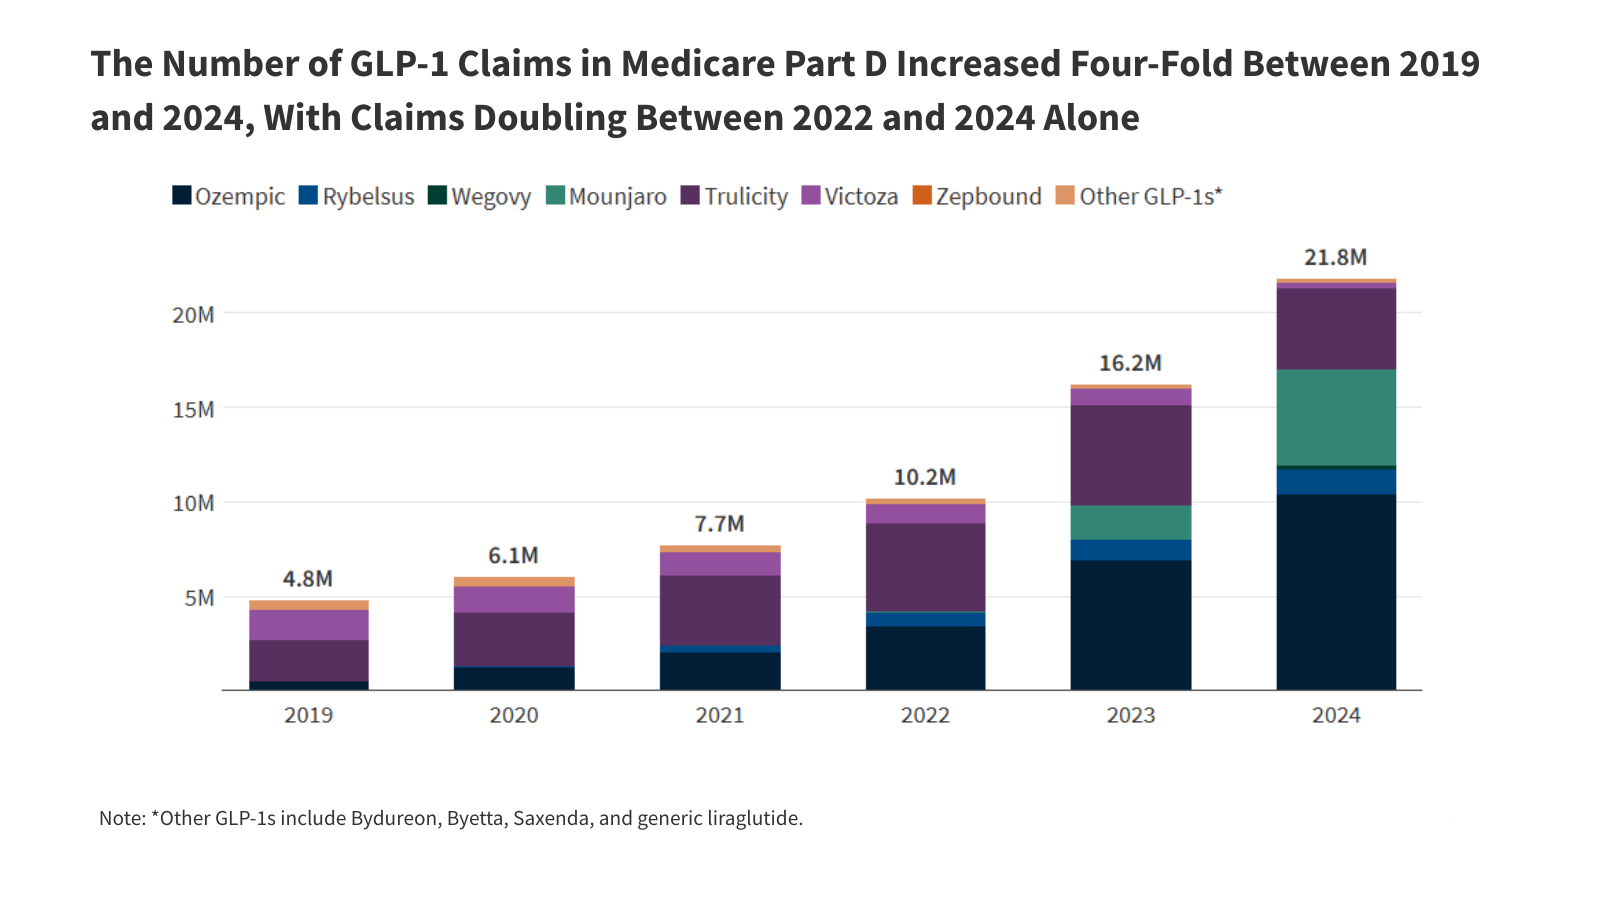
Second, comparisons with other developed countries also suggest substantial room for a major improvement in U.S. life expectancy (see Figure 1). Life expectancy at birth in the United States and other high-income countries has increased dramatically over the last 40 years. But progress in the United States has been slower than its peers, and the U.S. ranking has dropped from the middle of the group to the absolute bottom. Historically, two contributors to this poor performance have been deaths linked to smoking and obesity. Smoking has faded as an issue, but obesity remains important. To the extent that the new weight loss drugs become widely available, the United States might regain its position among other developed nations. In short, projections of future life expectancy may break to the high side – raising the cost of the Social Security program.
The discussion of the assumptions underlying the 2025 Report is not a critique but rather an effort to highlight the uncertainty that surrounds any projections made for the next 75 years and to identify factors that may make the high-cost alternatives more likely than the intermediate estimates. These developments – combined with the annual increase in the program’s deficit as the evaluation period shifts forward – means that Trustees Reports in the next few years may well show larger 75-year deficits in the coming years. Even with higher projected deficits, however, the levers are available on both the revenue and benefit side to restore balance. Congress just needs to act.
Publisher: Source link


