The Energy & Commerce Committee passed a reconciliation bill out of committee on May 14 after 26.5 hours of debate. Based on draft reconciliation language, the Congressional Budget Office (CBO) released preliminary estimates showing the proposals would reduce federal Medicaid spending by $625 billion. While there are a number of policy changes, three changes account for the vast majority of the savings: requiring states to implement work requirements for the expansion group, increasing barriers to enrolling in and renewing Medicaid coverage, and limiting states’ ability to raise the state share of Medicaid revenues through provider taxes. Building on earlier KFF analysis, this analysis puts this magnitude of federal funding cuts into context by showing how the cuts relate to states’ budgets and exploring the potential effects on Medicaid enrollment by state. Cuts of $625 billion will force states to make tough choices: maintain current spending on Medicaid by raising taxes or reducing spending on other programs; or cut Medicaid spending by covering fewer people, offering fewer benefits, or paying providers less.
This analysis allocates the CBO’s estimated reduction in federal spending across states based on KFF’s state-level data and where possible, prior modeling work, and explores the implications of those cuts for states’ choices about financing Medicaid. Beyond the spending implications, CBO estimates that the bill would decrease Medicaid enrollment by 10.3 million people in 2034, suggesting that most of CBO’s estimated savings stem from reduced enrollment. The CBO’s enrollment reduction is also allocated across the states in this analysis. However, anticipating how states will respond to changes in Medicaid policy is a major source of uncertainty in CBO’s cost estimates. Instead of making state-by-state predictions, CBO estimates the percent of the affected population that lives in states with different types of policy responses. For example, different states might choose to implement a work requirement with reporting requirements that are easier or harder to comply with. While the variation in responses across states could affect both spending and enrollment estimates, this analysis illustrates the potential variation by showing a range of enrollment effects in each state, varying by plus or minus 25% from CBO’s midpoint estimate.
The findings show the implications of the cuts in a single year using the average of the CBO 10-year score, but in practice, the effects will vary by year and grow over time. For example, the work requirements provision accounts for more than $300 billion of the savings but does not take effect until 2029 and this provision would only affect states that adopted the Affordable Care Act (ACA) Medicaid expansion. This analysis illustrates the increase in taxes or decrease in education per pupil that states would face if they used either option to offset the full amount of federal reductions; in practice states would likely adopt a range of options in response to federal reductions. (CBO estimates assume that in aggregate, states would replace roughly half of the reduced federal funds with their own funds). Additionally, CBO’s current estimate does not include all provisions in the Energy and Commerce reconciliation bill, so it is possible that effects on spending and enrollment could differ from what is reported here.
Key Take-Aways
- The three biggest sources of federal Medicaid savings in CBO’s preliminary estimate of the Energy and Commerce reconciliation package account for nearly 90% of the total savings and include:
- Mandating that adults who are eligible for Medicaid through the ACA expansion meet work and reporting requirements ($300.8 billion);
- Repealing the Biden Administration’s rule simplifying Medicaid eligibility and renewal processes ($162.7 billion); and
- Establishing a moratorium on new or increased provider taxes ($86.8 billion).
- Provisions that would only apply to states that have adopted the ACA expansion account for $374.2 billion, or 60% of the total federal savings.
- Federal cuts to states of $625 billion over 10 years (or $62.5 billion per year) would represent 20% of total state-financed Medicaid spending per resident. By state, the cuts as a share of Medicaid spending per resident range from 6% in Wyoming and 8% in Florida to 50% and 48% in Louisiana and Kentucky, respectively.
- Proposed federal cuts represent 4% of state taxes per resident. If states opted to raise tax revenues to offset the entire amount of federal Medicaid reductions states would need to increase taxes by 4% overall, with state-level increases ranging from 1% in Kansas and Wyoming to 11% in Louisiana and 10% in Kentucky.
- States could instead make cuts to other state programs to offset federal Medicaid reductions. Proposed federal cuts represent 13% of state education spending per pupil. If states opted to cut education spending, the largest source of expenditures from state funds, to offset the entire amount of federal Medicaid reductions, cuts per pupil would range from 2% in Wyoming and 3% in Kansas to 36% in Louisiana and 32% in Kentucky.
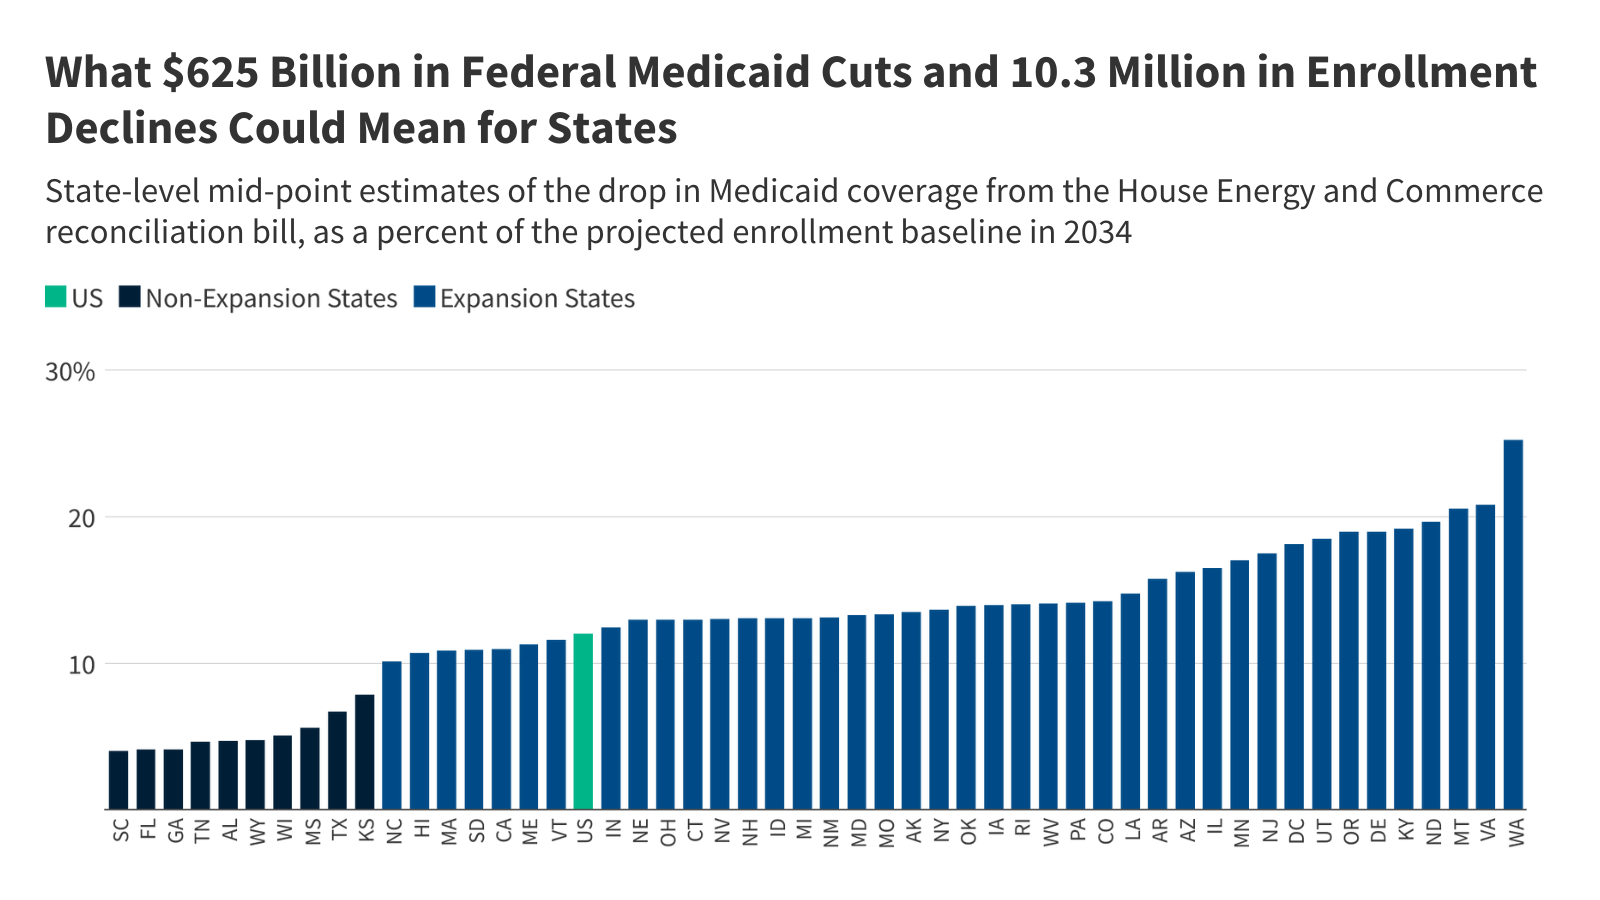
- CBO estimates that 10.3 million people will lose Medicaid but that reflects state responses in the aggregate.
- The most heavily affected states include: Washington, Virginia and Montana. In each of these states, Medicaid enrollment could decrease by 15% to 32%.
Methods |
| Data: This analysis uses the latest data available from various data sources to illustrate the potential impact of a $625 billion cut to federal Medicaid spending across states. Data sources include:
State Medicaid data from NASBO is reported for the state fiscal year (instead of federal fiscal year) and differs from other sources of Medicaid spending data. For that reason, this analysis uses spending per resident or pupil calculations to relate data across various sources. Estimating Annual Federal Cut: This analysis uses the 10-year average federal spending reduction from CBO’s cost estimate, which represents 12% of federal Medicaid funding in FY 2024 and 9% of federal Medicaid spending over 10 years. The estimated $2.9 billion in federal savings due to prescription drug spending cuts are not allocated across the states as those savings are not achieved by shifting costs to states or reducing Medicaid enrollment. Allocating $622 Billion Across States: This analysis allocates the one-year federal cut across states as follows:
For all estimates, the federal share of spending is estimated using a 90% match rate for the ACA expansion group and the FY 2024 traditional federal match rates plus a 1.5 percentage point increase for the first quarter of FY 2024 (accounting for the final phase out quarter of the pandemic-era enhanced federal match rate) for the remaining eligibility groups. Estimating State Medicaid Spending Per Resident: State spending per resident in FY 2024 is estimated using KFF’s projections of Medicaid spending under current law (assuming state spending is the difference between total spending and federal spending) and the U.S. Census Bureau’s 2024 estimates of resident population by state. The federal cuts per resident are then divided by state Medicaid spending per resident to estimate the federal cuts as a share of state Medicaid spending per resident. Estimating State Taxes Per Resident: State taxes per resident in FY 2023 from the U.S. Census Bureau’s Annual Survey of State Government Tax Collections (the latest data available and available for download here) is used as an estimate for state taxes per resident in FY 2024. The federal cuts per resident are then divided by state taxes per resident to estimate the federal cuts as a share of state taxes per resident. Estimating State Education Spending Per Pupil: State education spending in FY 2024 is estimated from NASBO’s 2024 State Expenditure Report (the latest available data). The analysis combines state general fund and other state fund spending on elementary and secondary education in estimated state fiscal year 2024 to approximate state education spending in FY 2024. This is divided by the number of K-12 students enrolled in fall 2023 by state (the latest data available) from the National Center on Education Statistics, Digest of Education Statistics to get state education spending per pupil. The total federal cuts by state are then divided by the number of students by state to get an estimate of federal cuts per pupil. Finally, the federal cuts per pupil are then divided by state education spending per pupil to estimate the federal cuts as a share of state education spending per pupil. Estimating Enrollment Effects: CBO’s estimated enrollment effects are allocated across the states proportionally to states’ estimated reduction in federal funding as estimated above. This reflects the fact that most of the provisions in the Energy and Commerce bill would reduce Medicaid spending by reducing Medicaid enrollment. Recognizing that CBO’s enrollment effects are the average effect and not an expected effect in any given state, the estimated enrollment effect for each state is shown as 25% higher or lower than the potential effect stemming from the CBO allocation. Limitations: This analysis uses a one-year framework to put the magnitude of proposed Medicaid cuts into context but does not estimate the effects either nationally or for specific states. The most significant limitations of this approach are as follows.
|
Publisher: Source link