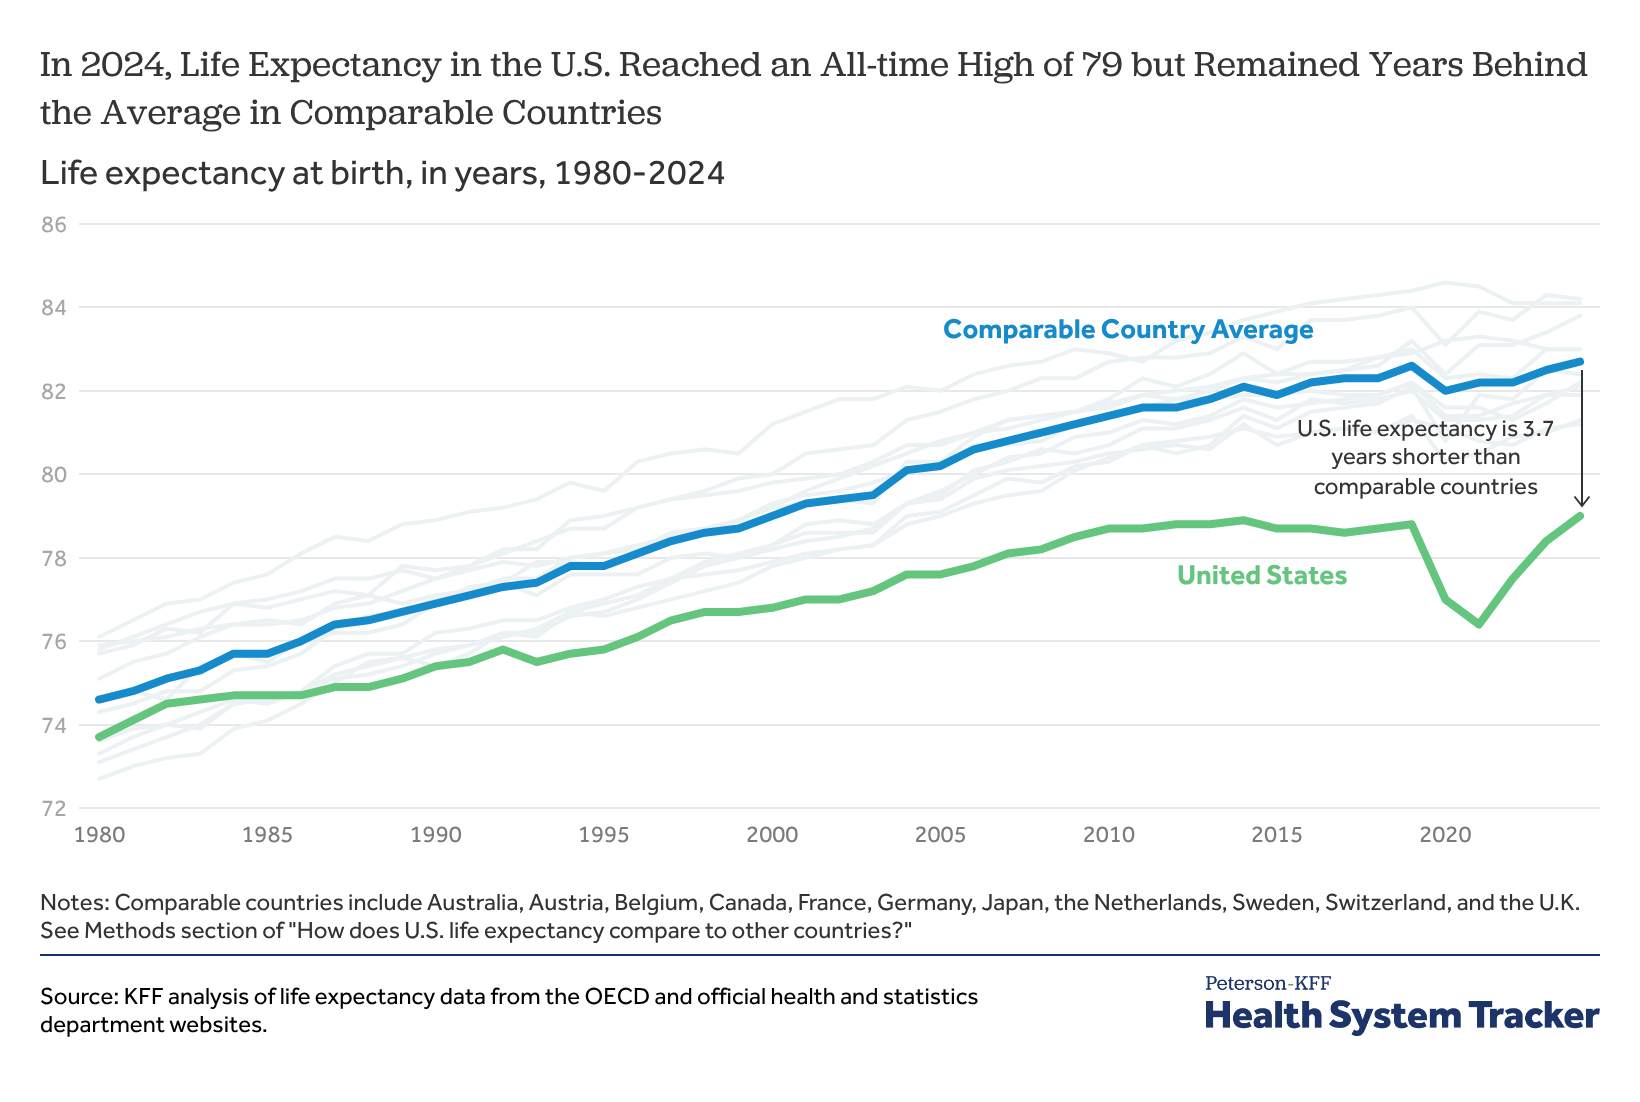
Health disparities and health access-related challenges persist among the LGBTQ+ community. While there have been various state and federal efforts over the last several years to address equity in the LGBT+ community, including with respect to health care access, nondiscrimination, and data collection, recent Trump Administration policy actions could reverse these developments. Additionally, potential changes in the health policy landscape could lead to insurance coverage losses, which could stand to exacerbate existing access challenges. In particular, efforts to restrict access to gender affirming care, including for adults, could lead to more medical mistrust, and reduce willingness to engage in the health system.
This brief presents key data points on the health care experiences of LGBT+ women from the KFF Women’s Health Survey, a nationally representative survey of women in the United States conducted from May 13 – June 18, 2024. This online and by telephone survey includes a sample of 3,901 women of reproductive age (18-49). Respondents were asked about their gender and sexual orientation. The LGBT+ sample (n = 676) in this brief includes respondents who identified as women and also identified as non-binary or transgender and/or said their sexual orientation was lesbian or gay, bisexual, or something else. The non-LGBT+ sample are respondents who identified as other women, those who are cisgender and heterosexual.
1. One in six (17%) women of reproductive age identify as LGBT+, with the largest share of LGBT+ women identifying as bisexual.
One in six (17%) women of reproductive age identify as lesbian, gay, bisexual, transgender, non-binary or something else (LGBT+) (Figure 1). Women ages 18 to 35 are twice as likely to identify as LGBT+ compared to women ages 36 to 49 (23% vs. 9%).
2. LGBT+ women are more likely to be younger than non-LGBT+ women but are similar in other demographic indicators.
Three in four reproductive age LGBT+ women are age 35 and younger (77%) compared to 53% of non-LGBT+ women (Figure 2). Nearly six in ten reproductive age LGBT+ women are White and nearly one in five are Hispanic, which is not significantly different than non-LGBT+ women. LGBT+ women are less likely to be Asian and more likely to identify as another race/ethnicity compared to non-LGBT+ women. Four in ten reproductive age LGBT+ women have household incomes below 200% of the federal poverty level (FPL), similar to non-LGBT+ women. Nine in ten live in an urban/suburban area, which is higher than non-LGBT+ women. A quarter of LGBT+ women are the parent or guardian of children under the age of 18, which is half the share of non-LGBT+ women (27% vs. 52%).
3. While the majority of reproductive age LGBT+ women have a regular health care provider, three in ten do not (31%). LGBT+ women are less likely to go to a private doctor’s office for care than non-LGBT+ women, but a higher share rely on clinics or do not have a place to go.
Despite being a younger population overall, LGBT+ women are more likely to report fair or poor health (Figure 3) than non-LGBT+ women. One in four reproductive age LGBT+ women (26%) describe their health as fair or poor compared to one in six non-LGBT+ women (16%). Most LGBT+ women have a usual site of care to go to when they are sick or need advice about health (92%), while only 8% say they do not have a place to go. LGBT+ women are less likely than non-LGBT+ women to go to a private doctor’s office for care, and a higher share do not have a place to go compared to non-LGBT+ women. While the majority of LGBT+ women have a regular doctor or health care provider (69%), three in ten do not (31%).
4. Similar shares of LGBT+ and non-LGBT+ women say they have received HIV and STI tests, but fewer report receiving a Pap test than non-LGBT+ women. One in seven (15%) LGBT+ women say they have never seen a doctor or nurse for an OBGYN exam.
Similar shares of LGBT+ women say they have received an HIV test (37% vs. 36%) and STI test (44% vs. 39%) compared to non-LGBT+ women in the past two years (Figure 4). However, a smaller share of LGBT+ women compared to non-LGBT+ women report receiving a Pap smear or Pap test to test for cervical cancer in the past two years. One in seven (15%) reproductive age LGBT+ women say they have never seen a doctor or nurse for an OBGYN exam, which was higher than non-LGBT+ women (10%).
5. One in five reproductive age LGBT+ women report having a disability, twice the rate of non-LGBT+ women.
While a younger population, among reproductive age LGBT+ women report who report a disability, one in ten have more than one disability (15%) (Figure 5). The largest share say they have a disability related to a mental health condition, which is significantly higher than non-LGBT+ women (16% vs. 4%). Just over one in ten (15%) LGBT+ women report having a developmental disability, such as a learning disability, compared to 2% of non-LGBT+ women. One in ten (11%) LGBT+ report having a physical disability compared to 6% of non-LGBT+ women. A similar share of LGBT+ and non-LGBT+ women report having a sensory condition, such as being visually impaired or deaf (1%).
6. About four in ten LGBT+ women (43%) report that they have been treated unfairly or with disrespect by a doctor or health care provider, especially based on their age, weight, or gender.
Nearly twice as many LGBT+ women (aged 18-49) compared to non-LGBT+ women (43% vs. 24%) the same age have felt that a doctor, health care provider or other staff treated them unfairly or with disrespect at some point in the past 2 years (Figure 6). They cite weight, gender, and age as the top reasons they were treated unfairly or with disrespect. Compared to non-LGBT+ women, a larger share of LGBT+ women say there was a time in the past 2 years when a health provider ignored a direct request they made or a question they asked (34% vs. 20%), assumed something about them without asking (32% vs. 19%), didn’t believe they were telling the truth (32% vs. 16%), suggested they were personally to blame for a health problem they were experiencing (29% vs. 13%), and refused to prescribe pain medication they thought they needed (15% vs. 9%). Eight percent (8%) of LGBT+ women say they have been treated unfairly or with disrespect because of their sexual orientation during a health care visit in the past 2 years.
7. Many LGBT+ women report experiencing mental health challenges. Half of reproductive age LGBT+ women describe their mental health as fair or poor compared to a quarter of non-LGBT+ women, and many say they have not gotten mental health services in the past year.
Half of LGBT+ women (aged 18-49) describe their mental health or emotional wellbeing as fair or poor compared to a quarter of non-LGBT+ women (50% vs. 27%) (Figure 7). While half of LGBT+ women say they have received mental health services from a doctor, counselor, or other mental health professional (51%), about half also say there was a time in the past 12 months when they thought they might need mental health services or medication, but didn’t get them (54%).
8. LGBT+ women report experiences with intimate partner violence at almost double the rate of non-LGBT+ women.
Over one in three reproductive age LGBT+ women say they have experienced intimate partner violence in the past 5 years, compared to 20% of non-LGBT+ women (Figure 8). Rates of all aspects of IPV asked about in the survey are twice as high in LGBT+ women compared to non-LGBT+ women. Approximately one in five LGBT+ women said that in the past five years, a current or former partner has made them fear for their or their family and friends’ safety (21%), tried to control most or all of their daily activities (23%), hurt them physically (19%), or forced them into sexual activity (21%).
9. Similar shares of sexually active LGBT+ and non-LBGT+ reproductive age women say they used contraception in the past year.
Eight in ten (81%) sexually active LGBT+ women report using contraception in the past year, similar to the share among non-LGBT+ women (81%). One in ten (10%) sexually active LGBT+ women say they were not using contraception. While a younger group, smaller shares of sexually active LGBT+ women report being pregnant or trying to conceive compared to non-LGBT+ women (5% vs. 9%). The shares of LGBT+ and non-LGBT+ women report being unable to conceive was the same (4%). One in ten LGBT+ women say they or their partners use contraception solely for reasons outside of preventing pregnancy, which is significantly higher than non-LGBT+ women (11% vs. 5%) (Figure 9).
10. Over a third (38%) of LGBT+ women have been pregnant including nearly one in ten (9%) who report having have had an abortion, both shares considerably lower rates than non-LGBT+ reproductive age women.
A larger share of reproductive age LGBT+ women say they have never been pregnant compared to non-LGBT+ women (62% vs. 35%) (Figure 10). About one in ten (11%) LGBT+ women say they or their partner have ever needed fertility assistance, including medical advice, testing, services or medication to help an individual or their partner become pregnant or prevent a miscarriage, which is similar to the 14% of non-LGBT+ women who have needed fertility assistance.
Publisher: Source link